Reports

HISTORICAL MANHATTAN INVESTMENT SALES NUMBERS

Since we submitted our Q1 2017 numbers we've received numerous requests for a historical view on where we are. This is a quick snapshot and insight into what the first quarters looked like over the past 10 years.

Q1 2007: $17.2B
Q1 2008: $5.0B
Q1 2009: $1.5B
Q1 2010: $1.53B
Q1 2011: $3.1B
Q1 2012: $5.7B
Q1 2013: $5.5B
Q1 2014: $9.6B
Q1 2015: $16.7B
Q1 2016: $10B
Q1 2017: $4.58B

Q1 2007 - Q1 2017 ($Billions)


MANHATTAN RETAIL VACANCIES HIT 4.1%

The New York City retail market experienced a slight decline in market conditions in the first quarter 2017. The vacancy rate went from 3.8% in the previous quarter to 4.1% in the current quarter. Net absorption was negative (54,419) square feet, and vacant sublease space increased by 12,981 square feet. Quoted rental rates increased from fourth quarter 2016 levels, ending at $89.86 per square foot per year. A total of 3 retail buildings with 114,528 square feet of retail space were delivered to the market in the quarter, with 2,381,590 square feet still under construction at the end of the quarter.

Net Absorption

Retail net absorption was slightly negative in New York City first quarter 2017, with negative (54,419) square feet absorbed in the quarter. In fourth quarter 2016, net absorption was negative (37,262) square feet, while in third quarter 2016, absorption came in at positive 560,933 square feet. In second quarter 2016, negative (157,549) square feet was absorbed in the market.

Tenants moving out of large blocks of space in 2017 include: Room & Board moving out of 30,500 square feet at 105 Wooster St; and Harlem NYC moving out of 30,000 square feet at 256 W 125th St.

Tenants moving into large blocks of space in 2017 include: Bed Bath & Beyond moving into 20,361 square feet at 5 W 125th St; TJ Maxx moving into 20,000 square feet at 5 W 125th street and Bed Bath & Beyond moving into 20,000 square feet at 2431 Broadway.

Vacancy

New York City’s retail vacancy rate increased in the first quarter 2017, ending the quarter at 4.1%. In prior quarters, the market has seen an overall increase in the vacancy rate, with the rate going from 3.7% in the second quarter 2016, to 3.5% at the end of the third quarter 2016, 3.8% at the end of the fourth quarter 2016.

The amount of vacant sublease space in the New York City market has trended up over the past four quarters. At the end of the second quarter 2016, there were 44,053 square feet of vacant sublease space. Currently, there are 88,375 square feet vacant in the market.

Largest Lease Signings

The largest lease signings occurring in 2017 include: the 47,286-square-foot-lease signed by Nordstrom Rack at 855 Avenue of the Americas; the 39,821-square-foot-deal signed by Target at 111 W 33rd St; and the 30,045-square-foot-lease signed by Town Sports International at 2 Astor Pl.

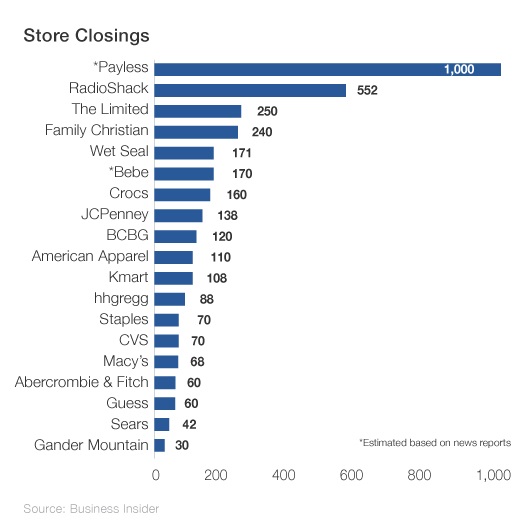
Nationwide Store Closings

Over the next 2 quarters several big chain retail companies have annouced the closing of over 3500 retail outlets throughout the country.

MANHATTAN OFFICE LEASING ACTIVITY UP 27%

Q1 2017 MANHATTAN OFFICE LEASING

4 World Trade Center

4 World Trade Center

Year-Over-Year the office leasing activity increased by approximately 27.63% in Q1 2017 in Manhattan's main business districts. Although there was a negative net absorption of 1.65 million square feet, compared with Q1 2016's negative 2.28 million square feet, there was 630,000SF of more leasing activity.

Although there was more activity the overall vacancy rate increased to 8.4% by the end of the first quarter. Comparatively, the vacancy rate was 8.2% at the end of the fourth quarter 2016, 8.2% at the end of the third quarter 2016, and 8.1% at the end of the second quarter 2016.

Class-A projects reported a vacancy rate of 9.4% at the end of the first quarter 2017, 9.2% at the end of the fourth quarter 2016, 9.5% at the end of the third quarter 2016, and 9.4% at the end of the second quarter 2016.

 Class-B projects reported a vacancy rate of 7.4% at the end of the first quarter 2017, 7.3% at the end of the fourth quarter 2016, 6.9% at the end of the third quarter 2016, and 6.8% at the end of the second quarter 2016.

 Class-C projects reported a vacancy rate of 5.8% at the end of the first quarter 2017, 5.4% at the end of fourth quarter 2016, 5.1% at the end of the third quarter 2016, and 5.3% at the end of the second quarter 2016.

The Financial District and World Trade Center area had its best quarter in two years. Leases including Spotify’s 378,000 square foot lease at 4 World Trade Center, brought the area to 2.3 million square feet of activity. This is 44 percent above the quarterly average since 2007.

In areas of Midtown South where activity is usually highest among tech and advertising firms, rents increased 11.7% to an average of $76.65 per square foot. Downtown rents dipped 2.2 percent to $56.45 per square foot, while Midtown rents crept up 1.1 percent to $75.78 per square foot.

There are about 11.7 million square feet worth of new office space expected to hit the market in Manhattan through 2020. Half of that space is committed.

MANHATTAN INVESTMENT SALES DOWN 50%

1 Vanderbilt

1 Vanderbilt

In the first quarter of 2017, Manhattan commercial real estate sales transactions were down about 50% compared to the same time in 2016. The market has been anticipating this slow down for some time, however, it comes as a big surprise that the numbers would be so drastic.

Recapitalization transactions and equity investments took center stage as 60 Wall Street and 1 Vanderbilt found new partners. Both transactions were foreign Asian capital sources, namely GIC from Singapore and National Pension Service of Korea respectively.

Not only was the total volume of sales transactions down, the number of deals were down 26%, and the average price per deals were down 32%. All indications point to a lackluster quarter, and a slow start to commercial real estate sales throughout the city. 

Okada & Company founder Christopher N. Okada believes "...it's a perfect storm of the city's lack of incentivizing development through 421-A programs [which may have just been revived], the financial institutions lending restrictions from laws like Dodd-Frank,  a rise in interest rates, a gap between what sellers are expecting and what purchasers are willing to take, and simply put a cooling of a red hot recovery... we knew it was coming. I guess the big question is; what's the next right move?"


CLICK HERE FOR THE MARKET REPORT